Term Searches
Search by keywords and gene IDs:
- CESA1
- AT4G32410
- Proline
Learn more about PlantConnectome and its novel utilities.
PlantConnectome offers three search options:
Search by keywords and gene IDs:
Finds and displays publications by author.
All search queries with hits return six results:

The number of abstracts in the database containing the search query is shown for reference.
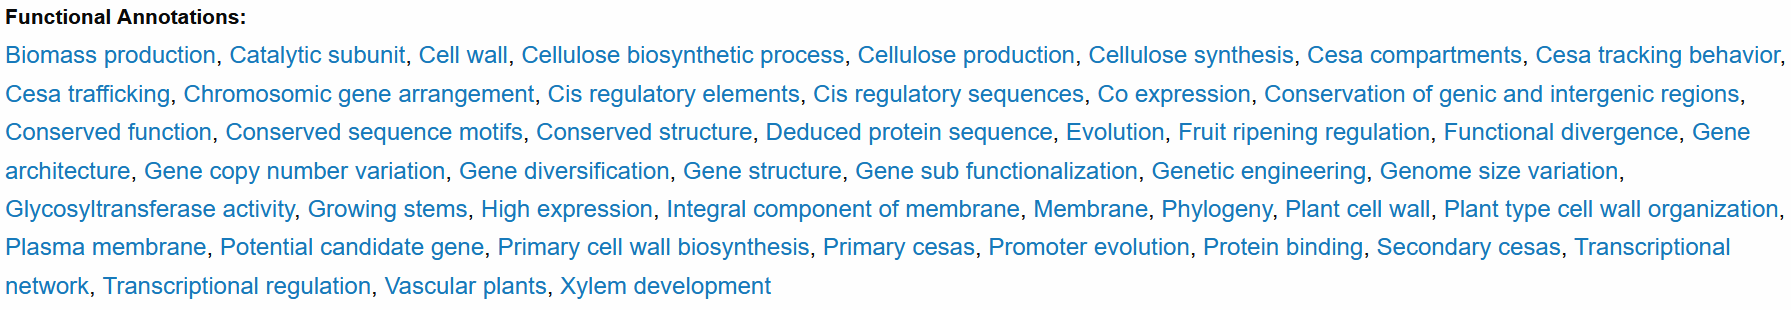
A collection of functions associated with the search query is displayed.

A collection of abbreviations associated with the search query is displayed.
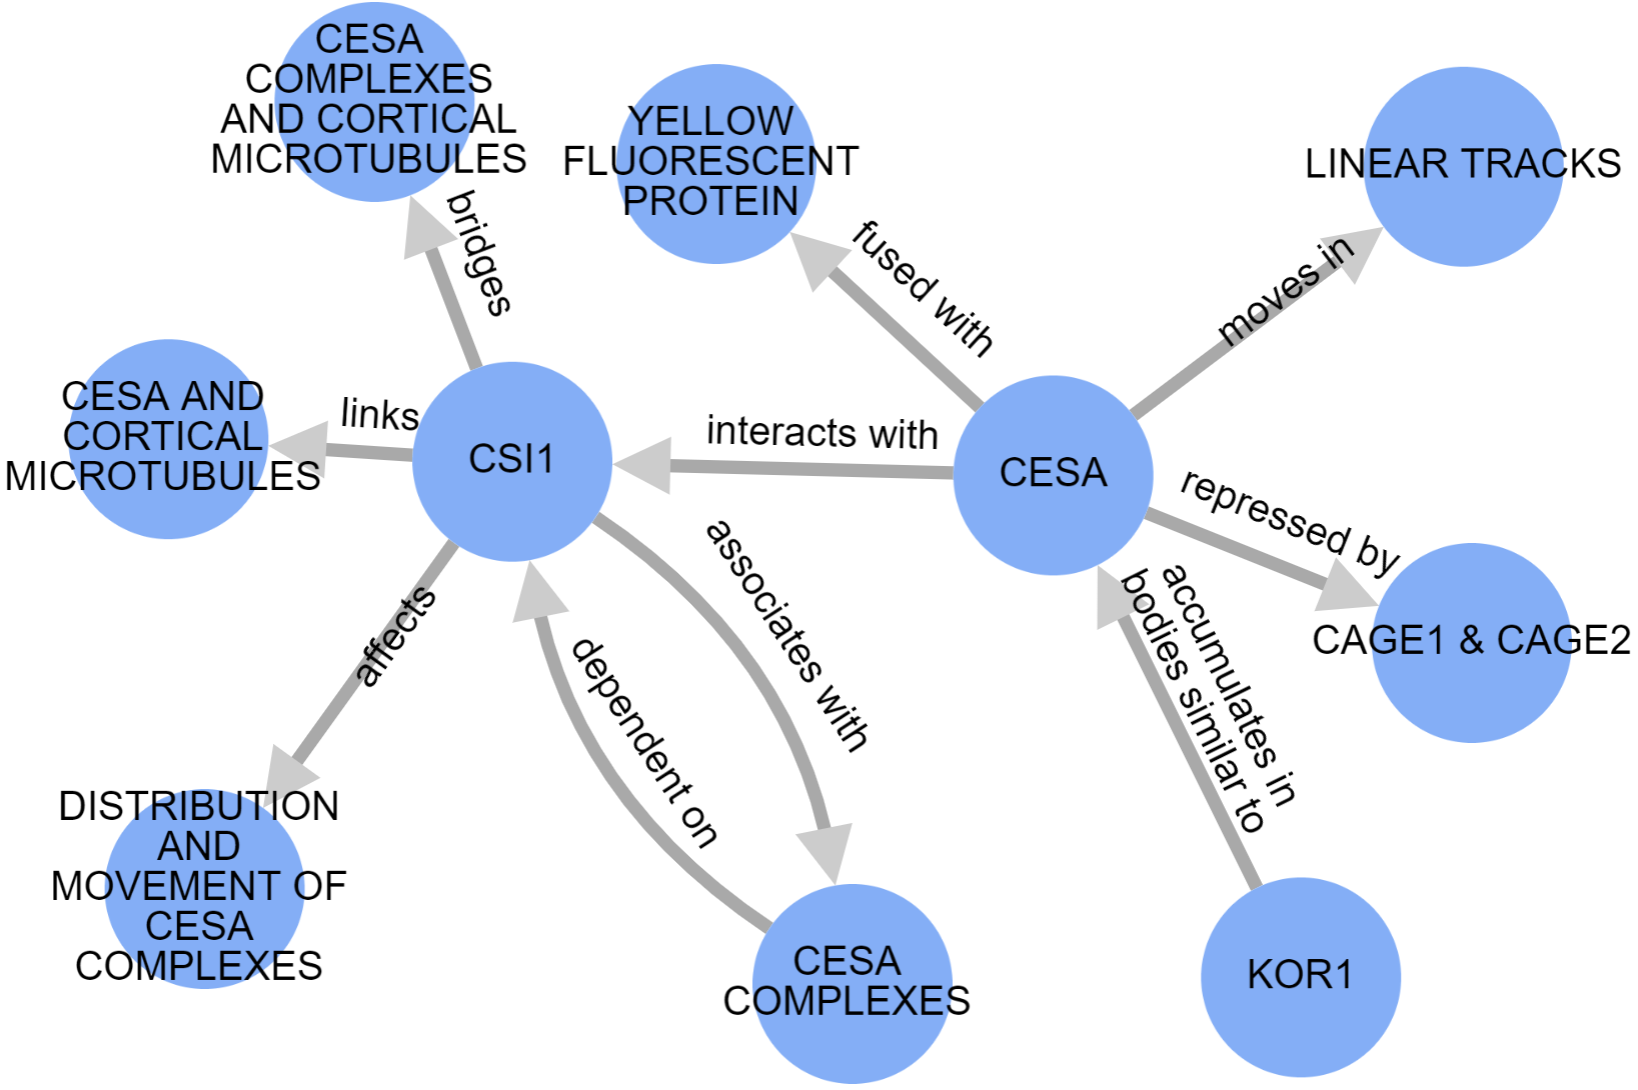
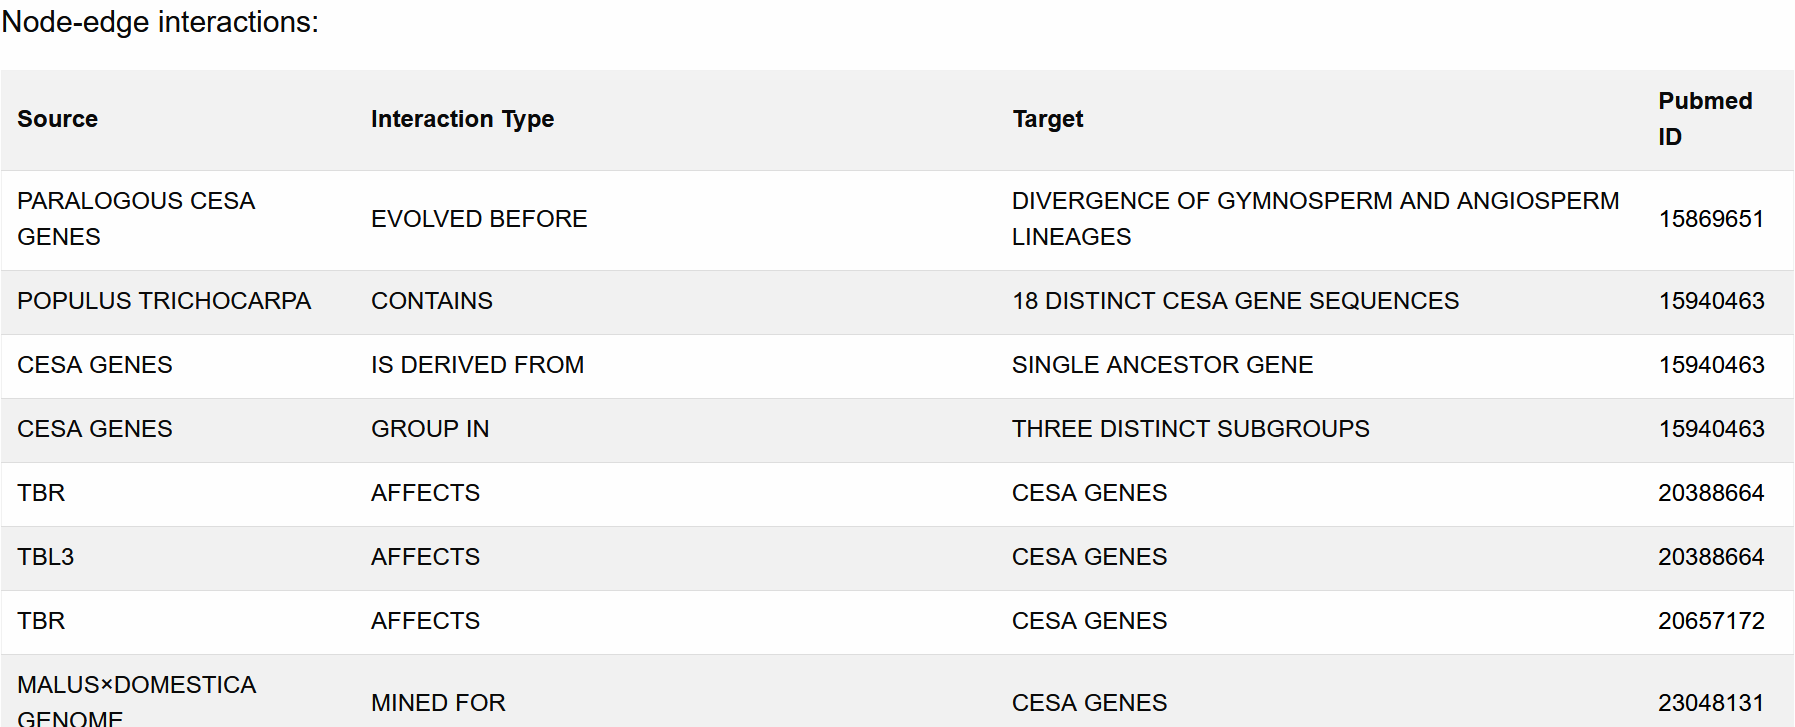
This directed graph summarizes the various entities in the database sharing relationships with the search query. Each circle (i.e., node) and arrow (i.e., edge) on the graph represents an entity and a relationship shared between two entities, respectively.
This graph is also interactive; the user can alter its appearance via several options.
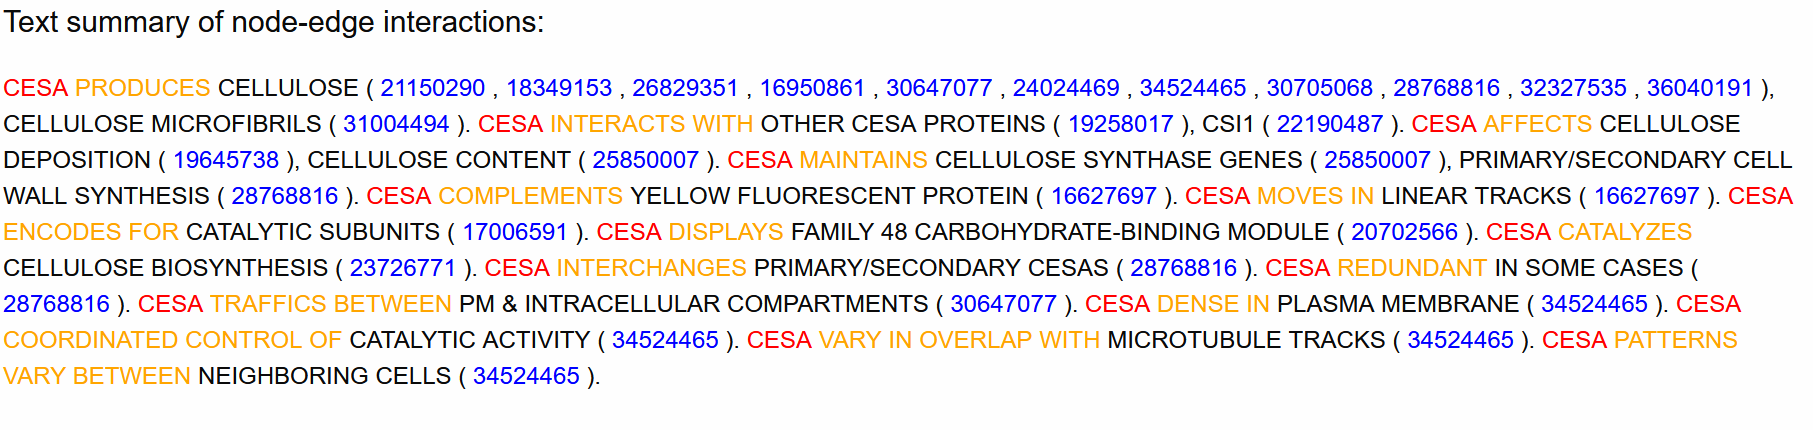
A text summary of the entity-relationship graph is shown for reference, where each paragraph corresponds to a separate cluster of nodes.